How to Calculate Your Solar Savings in Massachusetts (And Why Most Online Calculators Get It Wrong)

By Dave Simmer
NABCEP-Trained Solar Professional — Scituate, MA
I've been designing and installing solar systems across the South Shore since 2011. In that time, I've noticed a pattern: almost every homeowner I talk to has already punched their address into an online solar calculator before we ever speak. Whether it's EnergySage, SolarReviews, or a quick Google search tool, they've seen a number. My job in this guide isn't to replace those tools. It's to explain exactly what goes into those calculations so you can evaluate whether the number you saw is realistic, or if it's based on generic assumptions that don't apply to your Massachusetts home. I'm Dave Simmer, a NABCEP-trained solar installer based in Scituate, and I prefer real math over marketing math.
The Five Variables That Determine Your Solar Savings
When you strip away the flashy graphics of an online calculator, your projected solar savings come down to a math equation built on five specific variables. The first is your current electricity usage, measured in kilowatt-hours (kWh) per year. The second is your current electricity rate — and in Massachusetts, this is the heavy hitter. The average rate of approximately $0.25 to $0.34 per kWh (including delivery) is what makes solar so financially compelling here (learn how net metering works in Massachusetts).
The third variable is how much sunlight your specific roof receives, which is dictated by its angle, orientation, and shading from trees or neighboring structures. The fourth is the size and efficiency of the solar system we can actually fit on that usable roof space. Finally, the fifth variable is the incentive programs you enroll in, specifically Massachusetts net metering and the SMART program. Change any one of these inputs, and the final savings number shifts dramatically.
How to Find Your Actual Electricity Usage
If you want to know what solar can save you, you have to know what you're currently spending — not just in dollars, but in energy. You can find your annual kWh usage on your National Grid or Eversource bill, usually displayed in a historical usage graph.
Using only one month's bill gives you a distorted picture. A July bill reflecting heavy air conditioning use will make a system look more necessary than it might be, while an October bill might suggest you barely need any panels at all. An "average" South Shore home might use 8,000 to 10,000 kWh annually, but a high-usage home with electric vehicles, heat pumps, or an electric water heater can easily double that. Furthermore, if you are planning future usage changes — like adding an EV or switching from oil to electric heat — those future loads must be factored into the system sizing today.
Why Your Electricity Rate Matters More Than Anything Else
Massachusetts homeowners pay some of the highest electricity rates in the continental United States. For National Grid customers on the South Shore, the average rate when you combine generation and all delivery charges sits around $0.25 to $0.34 per kWh. This rate is the engine of your solar savings.
Under Massachusetts net metering rules (see the full Massachusetts solar incentives guide), you are credited for the excess solar power you send to the grid at a rate that mirrors this full retail rate, not just the lower generation rate. In concrete dollar terms, this means a solar system producing 12,000 kWh annually at $0.34 per kWh is generating about $4,000 in grid offset value every single year. The higher the utility rate climbs, the more valuable your solar production becomes.
What "Production Estimate" Actually Means
A production estimate is the calculated prediction of how much electricity your panels will generate over a year (and helps determine what size solar system do I need?). It is not a guess. Solid estimates rely on local solar irradiance data — the historical measurement of how much sun your specific geographic area receives.
Industry-standard tools like PVWatts, which NABCEP-trained designers use, factor in your roof's exact tilt, its azimuth (the compass direction it faces), and precise shading measurements. This is why two identical 10 kW systems on houses across the street from each other can produce very different amounts of energy. Even shading a small portion of a roof for a few hours a day can have an outsized impact on total production. When I build a production estimate, I don't use generic regional averages; I use satellite data and shading analysis specific to the exact planes of your roof.
Where Online Calculators Tend to Overestimate
Online calculators are designed to generate leads, and big savings numbers generate more leads. One common way these tools inflate projections is by applying the 30% federal Investment Tax Credit (ITC), which expired at the end of 2025 and is no longer available for new installations in 2026. (See what solar incentives are left in Massachusetts after the federal credit).
Another frequent error is assuming perfect, unshaded roof conditions, which is rare in tree-heavy New England. They also frequently project aggressive electricity rate escalation, assuming utility rates will rise 4% to 5% every single year for 25 years. While rates have certainly risen, compounding that aggressively inflates the long-term savings figure massively. These inaccuracies aren't always malicious; generic tools simply cannot account for the nuance of your specific roof geometry, local shading, or current Massachusetts policy.
A Real-World Savings Example for a South Shore Home
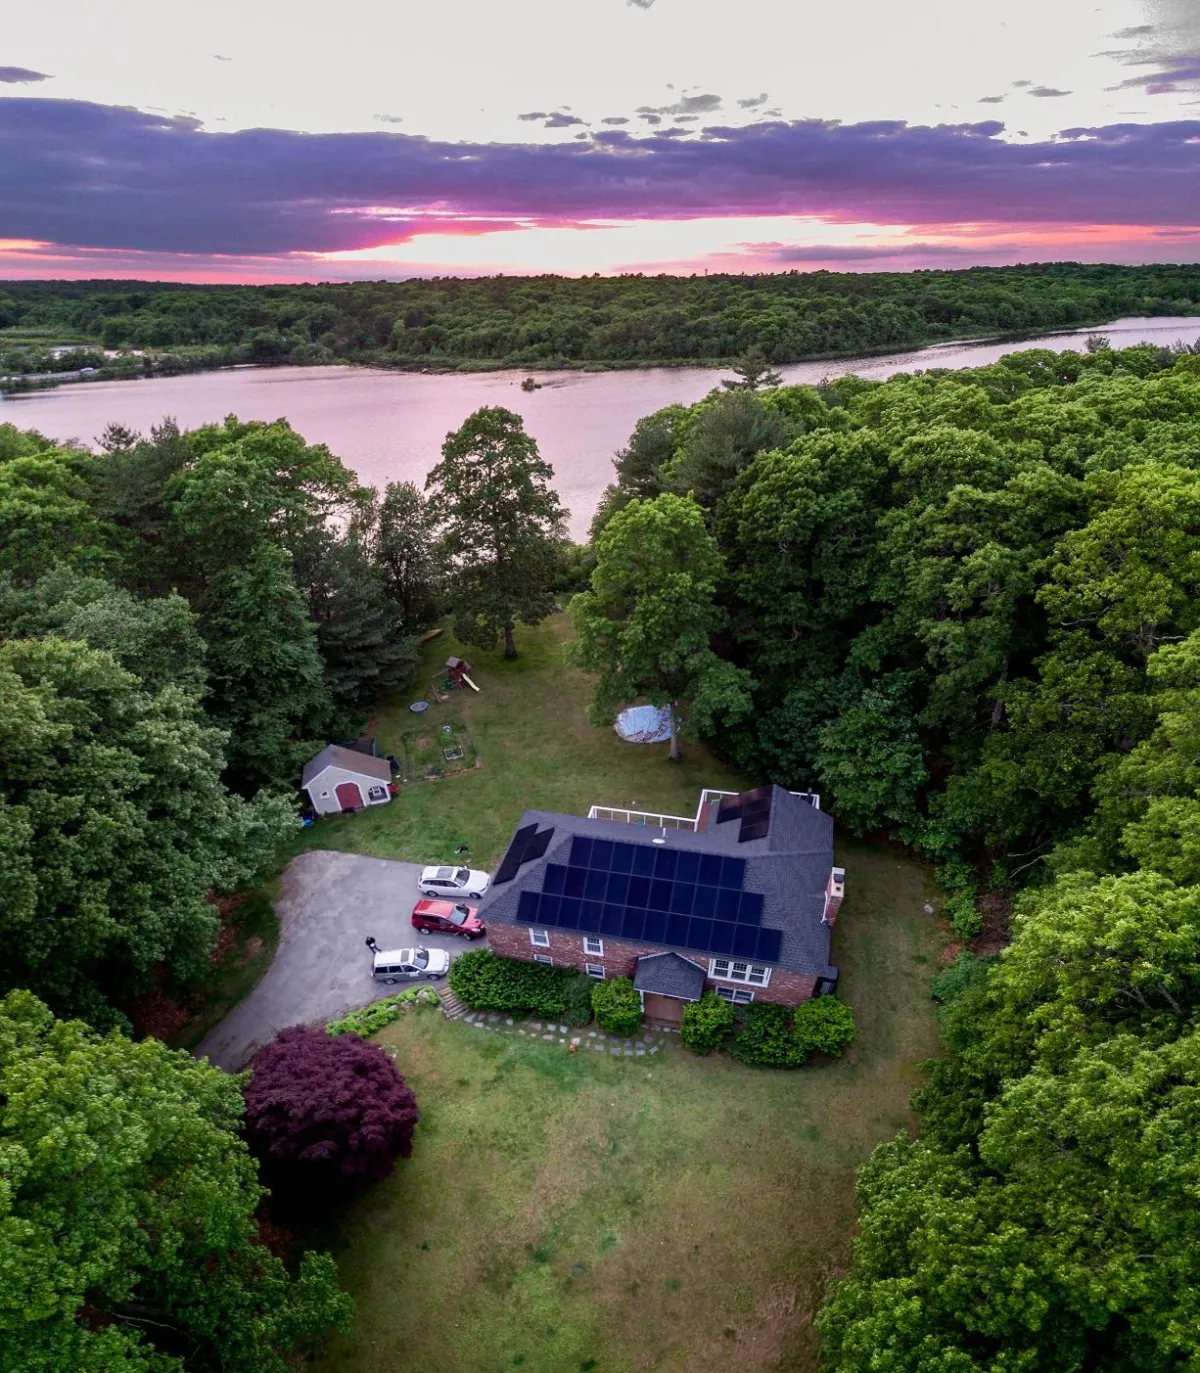
Let's look at a realistic scenario based on a recent installation in Scituate (or see more recent project examples). We designed a 10 kW system on a largely unshaded, south-facing roof. The total system cost was $33,000 before any state incentives.
Based on the roof's orientation, we estimated an annual production of 11,500 kWh. At the homeowner's National Grid rate of $0.34 per kWh, that production provides a net metering value of roughly $3,900 per year. Add in the SMART program payment (read the SMART program guide), which contributes an additional $345 annually, and the total year-one value of the system is approximately $4,245. When you factor in the $1,000 Massachusetts state tax credit reducing the net cost, this system is on track to pay for itself in about 7.5 years. After that payback period, the system continues to generate effectively free electricity for the remainder of its 25-plus year lifespan.
How to Use Solar Dave's Savings Calculator
If you want a more grounded estimate, I built my own calculator specifically for Massachusetts homeowners. You can find it at solardavema.com/calculator. It uses realistic inputs for South Shore utility rates and doesn't bake in expired federal tax credits or aggressive rate escalation assumptions.
It is designed to give you a conservative, honest estimate rather than an inflated marketing number. The output will give you a solid baseline of what a properly sized system might cost and what it could realistically save you, based on the actual math we use in the field today.
When the Numbers Need to Be More Precise
Online calculators and guide estimates are excellent starting points, but they are just that — starts. To get the accurate number you need to make a financial decision, we need to look at your actual electric bill, perform a proper shading analysis, and create a real system design.
When I do a free estimate for a homeowner, I pull the satellite imagery for your specific address, analyze the roof planes, check the local utility rates, and run the production models. I then present a clear breakdown of the costs, the expected production, and the timeline for return on investment. There is no pressure and no hard sell — just the clear, precise numbers you need to decide if moving forward makes sense.
The Bottom Line on Solar Savings Estimates
The number you saw in an online calculator is a rough sketch. For most South Shore homeowners with solid sun exposure and a meaningful electric bill, the real numbers are genuinely compelling — but they need to be built on your specific roof and usage, not a national average. That is exactly what I do.
Ready to see your real numbers?
If you want to understand what a system actually costs and saves before you think about moving forward, you can run your own numbers or have me take a look. (Or see how the process works).